Australian COVID-19 scenario model
This is an implementation of the disease transmission model described in the paper Coronavirus Disease Model to Inform Transmission Reducing Measures and Health System Preparedness, Australia (doi:10.3201/eid2612.202530).
The following scenarios are predefined by episcen.covid.scenarios():
- “Unmitigated” (COVID_AU_Baseline)
Epidemics produced in the absence of interventions.
- “Q + I” (COVID_AU_Full)
Epidemics produced subject to case-targeted interventions (quarantine and isolation).
- “Dist 25%” (COVID_AU_Dist1)
Epidemics produced subject to case-targeted interventions (as above) and social distancing measures that reduce transmission by 25%.
- “Dist 33%” (COVID_AU_Dist2)
Epidemics produced subject to case-targeted interventions (as above) and social distancing measures that reduce transmission by 33%.
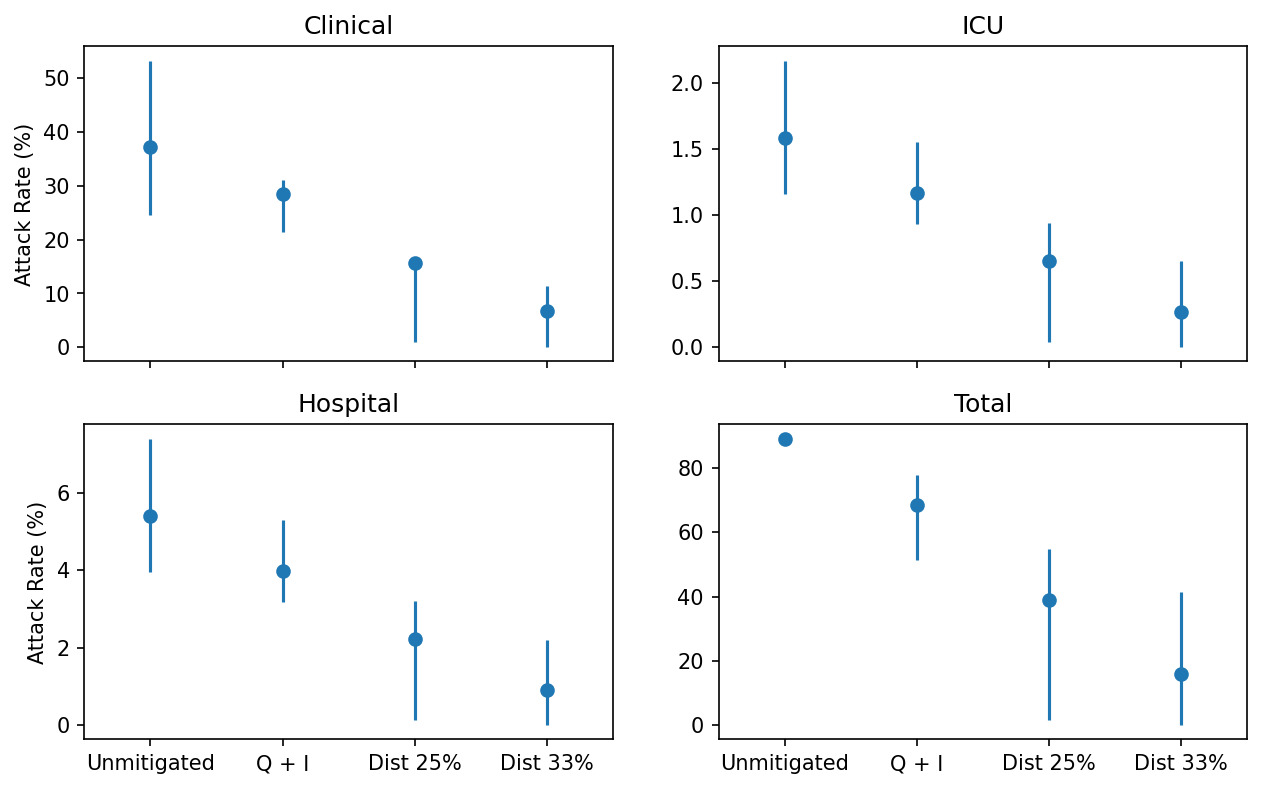
Attack rates obtained from each of the four Australian COVID-19 scenarios. Points show median outcomes, and lines show the 5%–95% percentiles.
You can run the scenario simulations and produce the above plot with the following command:
python3 -m episcen.covid
Main functions
- episcen.covid.scenarios()
Return the COVID-19 scenario definitions.
- Return type:
io.StringIO
- Examples:
>>> import pypfilt
>>> import episcen.covid
>>> instances = list(pypfilt.load_instances(episcen.covid.scenarios()))
>>> print(len(instances))
4
>>> ids = set(instance.scenario_id for instance in instances)
>>> print(ids == {'COVID_AU_Baseline', 'COVID_AU_Full',
...               'COVID_AU_Dist1', 'COVID_AU_Dist2'})
True
- episcen.covid.plot_attack_rates(png_file='COVID_AU_attack_rates.png')
Plot the attack rates for each scenario.
Note
You must run the scenario simulations before calling this function.
- Parameters:
png_file – The PNG file to which the plot will be saved.
- Raises:
FileNotFoundError – if the scenario output files do not exist.
Simulation components
- class episcen.covid.Model(*args: Any, **kwargs: Any)
The Australian COVID-19 scenario model.
The population is divided into \(N_S\) strata. The state vector contains the following fields:
Model parameters (floats):
“eta” (scalar): The proportion of infections that present with severe symptoms.
“alpha_m” (scalar): The proportion of infections that present with mild symptoms.
“R0” (scalar): The basic reproduction number.
“R0_scale” (scalar): The scaling factor for R0, which accounts for the transmission probability and contact rate matrices.
Infection compartments (integers):
“S” \((N_S)\): The susceptible population.
“E1” \((N_S)\): The early incubation period.
“E2” \((N_S)\): The late incubation period.
“I1” \((N_S)\): The early infectious period.
“I2” \((N_S)\): The late infectious period.
“R” \((N_S)\): The recovered population.
“M” \((N_S)\): Managed cases, ascertained upon leaving “I1”.
“RM” \((N_S)\): The recovered population of managed cases.
Contact-tracing compartments (floats):
“CT_m” \((N_S)\)
“CT_nm” \((N_S)\)
Quarantine compartments (integers):
“E1q” \((N_S)\): The early incubation period (quarantined).
“E2q” \((N_S)\): The late incubation period (quarantined).
“I1q” \((N_S)\): The early infectious period (quarantined).
“I2q” \((N_S)\): The late infectious period (quarantined).
“Rq” \((N_S)\): The recovered population (quarantined).
“Mq” \((N_S)\): Managed cases (quarantined).
“RMq” \((N_S)\): Recovered managed cases (quarantined).
Event counters (integers):
“Cum_Out_I1” \((N_S)\): The number of people who have left “I1”.
“Cum_Out_I1q” \((N_S)\): The number of people who have left “I1q”.
“Cum_Managed” \((N_S)\): The number of people who have entered “M” or “Mq”.
“Cum_Mild” \((N_S)\): The number of people who left “I1” or “I1q”, and have mild symptoms.
“Cum_Severe” \((N_S)\): The number of people who left “I1” or “I1q”, and require hospitalisation.
“Cum_ICU” \((N_S)\): The number of people who left “I1” or “I1q”, and require ICU admission.
- class episcen.covid.AttackRates(*args: Any, **kwargs: Any)
A summary table that calculates the attack rate for each counter in the state vector (i.e., for fields whose name begins with
"Cum_").
- class episcen.covid.DailyCases(*args: Any, **kwargs: Any)
A summary table that calculates the daily increase for each counter in the state vector (i.e., for fields whose name begins with
"Cum_").
Internal functions
- episcen.covid.dependent_dists(indep_values, dep_params)
The dependent distributions function for the COVID-19 scenario model.
- episcen.covid.dist_alpha_m(eta)
Construct the prior distribution for \(\alpha_m\).
- Parameters:
eta – The case-severity parameter \(\eta\).
- episcen.covid.calc_contact_matrix(pi)
Return the contact matrix for a stratified population.
- Parameters:
pi – An array that defines the fraction of the population that belongs to each stratum.
- episcen.util.outflow(n, p, rnd)
Sample the number of individuals that leave each compartment.
- Parameters:
n (numpy.ndarray) – The number of people in each compartment.
p (numpy.ndarray) – The probability that an individual will leave each compartment.
rnd (numpy.random.Generator) – A source of random numbers.
- Return type:
numpy.ndarray
- episcen.util.split_outflow(n, p, rnd)
Split the individuals that leave each compartment into two flows.
- Parameters:
n (numpy.ndarray) – The number of people leaving each compartment.
p (numpy.ndarray) – The probability that an individual will be selected for the first flow out of each compartment.
rnd (numpy.random.Generator) – A source of random numbers.
- Return type:
(numpy.ndarray, numpy.ndarray)